Custom Power BI Visuals by Zebra BI

This weeks post will be a short testament to a development venture by a few of my countrymen. Like most of Excel fans, I’m also a big fan of Power BI and it’s reporting capabilities. But having said that, the built-in visuals have often left me wishing I was in Excel and I could do a bit of customising. About two weeks ago I started playing around with Zebra BI Power BI visuals and I must admit, I was extremely impressed. Up to a point where I said to myself, people should hear about this and that is why I wrote this post.
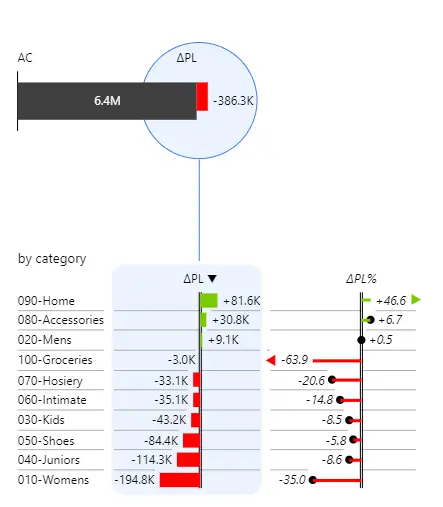
If BI reporting is something you do regularly, than you need to try this out. You can see them in action here:
https://zebrabi.com/pbi/
And you can see what they can do in this webinar:
https://zebrabi.com/power-bi-webinar/
Related Posts
- November 16, 2021
We’re continuing our quest for beautiful and dynamic ...
- November 9, 2021
Let’s look at some crucial tools for creating polished ...
- April 28, 2020
We often work with large datasets containing multiple columns, ...
- April 14, 2020
How to get the top 10 values in a table, and an aggregate for all ...
Excel Unplugged acknowledgements


Donate