Data Types – Part 2 – Create Your Own Data Types in Power BI

Let’s see how to create your own data types in Power BI! This is a follow up of Part 1, where we learned how it’s done in Power Query.
How-to
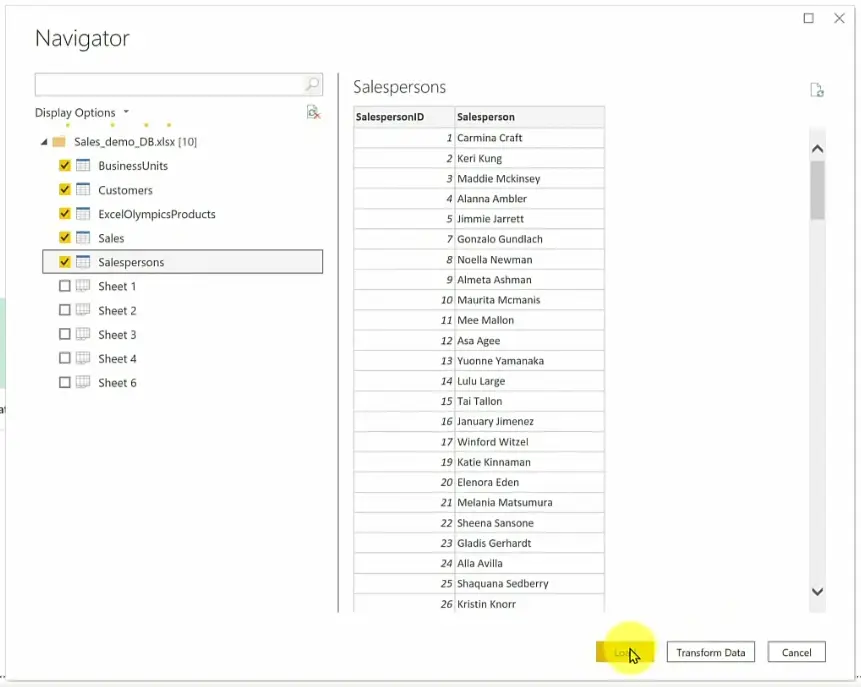
We start by loading the following Excel tables in Power BI. We won’t pay much attention to their contents, we’re only interested in ExcelOlympicsProducts table, which is the same table as in Part 1.
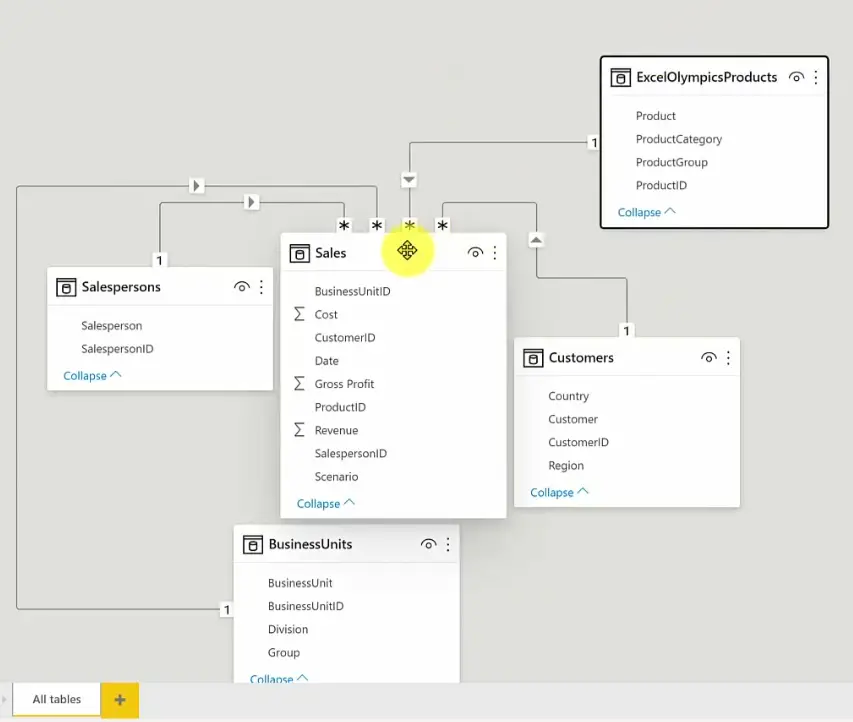
 Power BI recognizes the identical column names and types and automagically creates connections, so we get a pre-made model.
 We could now go to report mode and build from there, but we’re not going to. We want to make
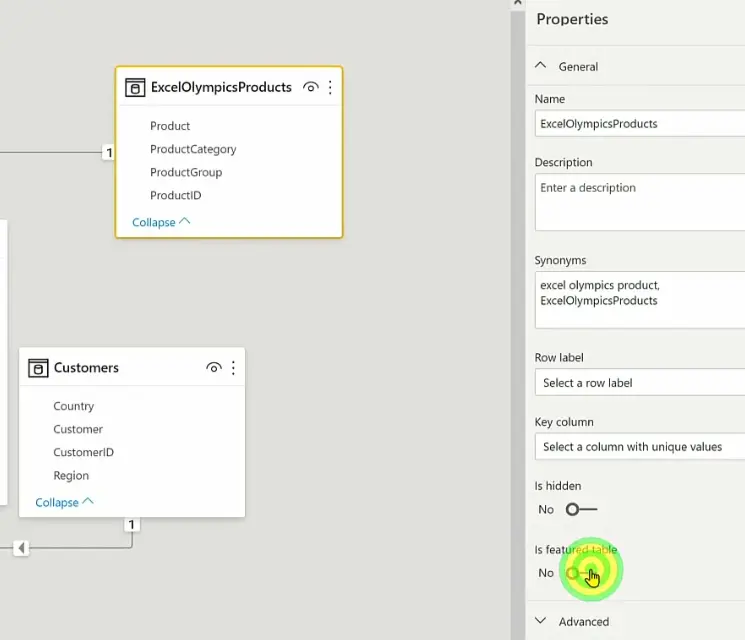
ExcelOlympicsProducts table organizational data type. All we need to do is the following.
Select the ExcelOlympicsProducts table and Is featured table property in the Properties pane on the right.
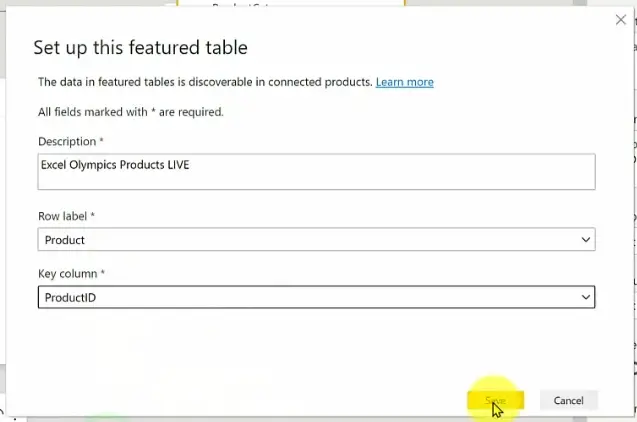
Set up the featured table: set the Excel Olympics Products LIVE as Description, Product as Row label and ProductID as Key column.
As a result, after confirming our table gets the following icons.

Save and Publish the report to your workspace.
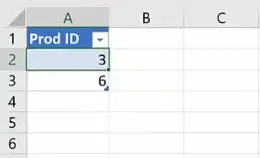
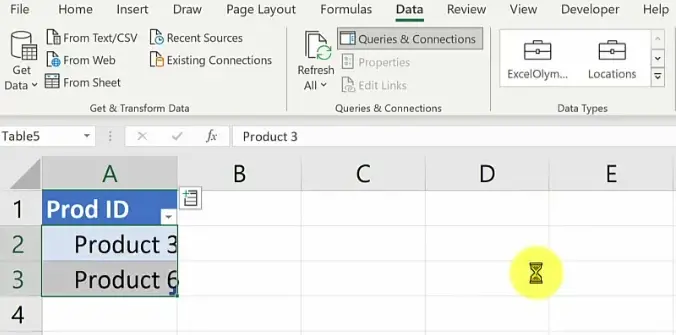
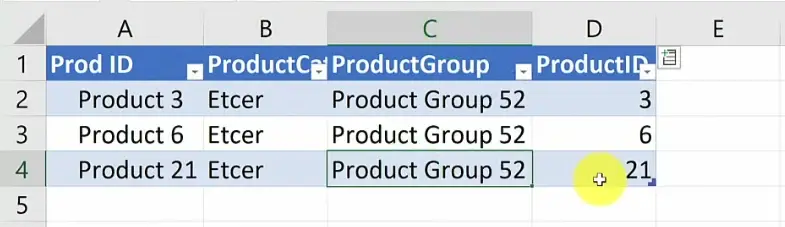
We now return back to Excel. Let’s remember some product IDs: 2 and 6.
Make a new table
We make a new table. We go to a new sheet and create a table with the two product IDs. Name the header row Prod ID, just so it’s not called exactly the same.
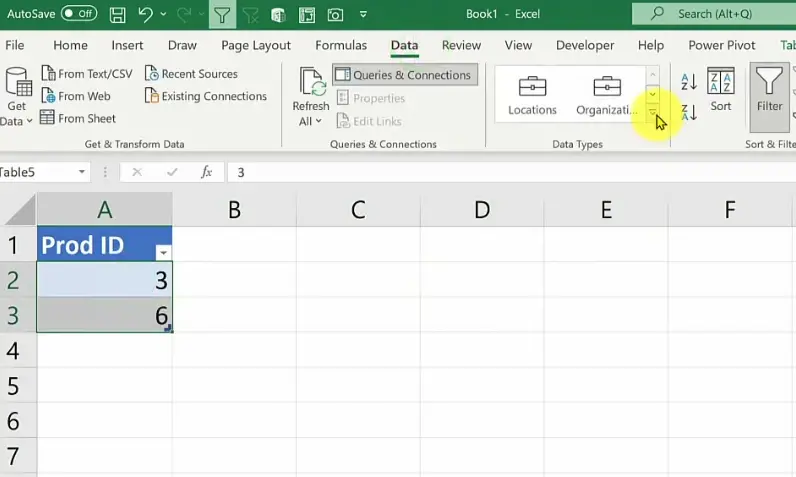
Select both values and then go into Data > Data types.
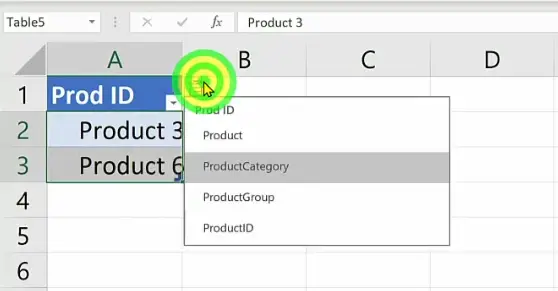
 Importantly, you will now see ExcelOlympicsProducts data type!
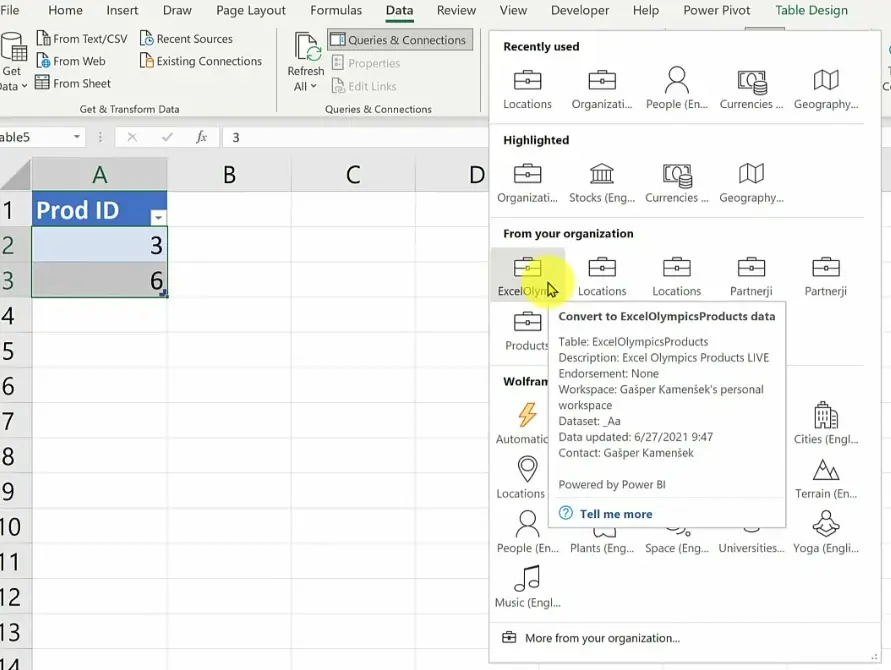 Firstly, we select the ExcelOlympicsProducts data type, and we get the following.
Secondly, we click the icon on the right and we get the available columns for expansion.
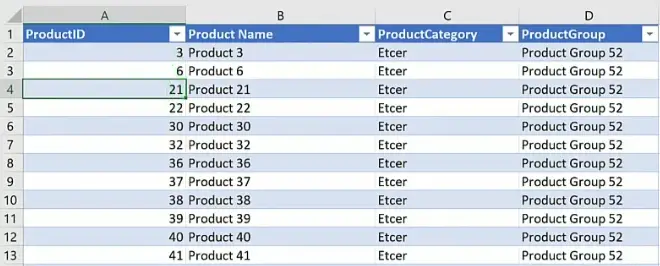
Thirdly, we add ProductCategory, ProductGroup, ProductID.
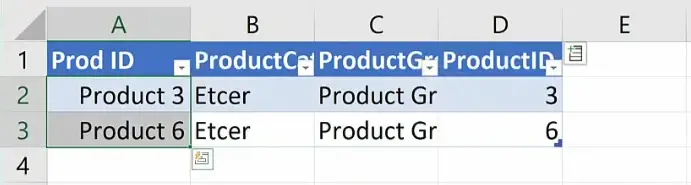
You see how brilliant this is? We have our BI report and we’re pulling data back to Excel!
For example, let’s type in 21.
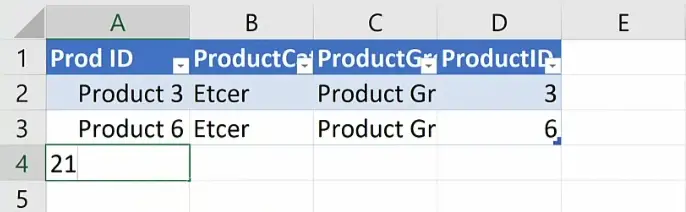
The row gets filled automagically!
In conclusion, this sums up our example of how to create your own data types in Power BI. We bet this made your day – and if not, you should probably read the article again!
Moreover, stay tuned for Part 3, where we’ll do the same using ScriptLab and JavaScript. That’s right, we know all you code gurus out there are just excited as we are!
Watch the tutorial
Meanwhile, you can also watch the tutorial online on our YouTube channel!
Please leave us a like, comment, and subscribe for more amazing Excel tricks!
Furthermore, follow us on LinkedIn.
And check out R Academy!
Excel Unplugged acknowledgements


Donate