Does a Power Pivot Pivot Table beat a regular Pivot Table

Does a Power Pivot Pivot Table beat a regular Pivot Table? Hands down, YES!
If you would like to read about the comparison of definitions of the two, you can do so in the Pivot Table vs Power Pivot post. And there is also a video version of this post available here or at the end of this post.
If you are new to the PowerPivot Add-In, or if you just heard it being mentioned in passing, what you should know is that PowerPivot is a game changer. Before Excel 2010, Microsoft was gently laying down the groundwork. Being in a strictness of “You should use Tables in Excel, and you can’t go wrong” (and you should) or being that they slowly brought the file format to the xlsx with the XML and ZIP and meta data… Everybody noticed the visual change from menus to the ribbon, but underneath something far greater was about to emerge.
It all started with Excel 2010 and the PowerPivot Add-In. Up to that point, Microsoft knew that Excel is the application that no company can go without, but it had serious limitations. The 216 or 220 of rows ( 65536 and 10480576) which might sound impressive is nothing when talking about Big Data or even smaller Databases. Even worse, those are the theoretical limitations of Excel whereas the practical ones are far smaller. With a few 100000 rows filled, the file becomes too slow and Excel can no longer do Automatic calculations. Knowing this, Microsoft was also aware that there were people doing serious magic in their SQL and SharePoint servers but there was a serious gap between MDX (MultiDimensional eXpressions) and OLAP (OnLine Analytical Processing) constructions and knowledge of Excel that normal Excel users possessed. They had no means to analyze the data without the help of a SQL and SharePoint masters. And let’s face it one data source per Pivot Table is a big stretch for the best analytical engine out there.
With Power Pivot (not a mistake, it should be Power SPACE Pivot now (I guess it’s something to do with registration)) they added a so called DAX (Data Analysis Expressions) language and leveled the playing field. It had some functions that Excel users were already familiar with and some Time intelligence functions that people writing SQL queries already knew. But for both it was a learning Experience. But what it did is it brought the two worlds together.
Just a short mention, in Excel 2010 and especially Excel 2013 the word Power is the key. Now you have Power Pivot (PowerPivot), Power Query, PowerView and PowerMap who combined give an Excel 2013 user the analytical power never seen before. And also worth mentioning, PowerView or PowerMap cannot function without Power Pivot. Data has to be stored in a Data Model that is Power Pivot.
Ok, but this article is not about Power Pivot and DAX, it’s about Pivot Tables, which can now come from a simple Table in Excel or from a Power Pivot Data Model. In Excel 2010 you can actually see the difference in the Pivot Table field list because it adds the Slicers Vertical and Slicers Horizontal fields.
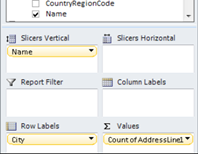
In Excel 2013 they were removed and the difference cannot be seen this way.
So if the difference cannot be seen, is there a difference?
Yes! There are two main differences just in Excel.
Data Sets in Power Pivot based pivot tables
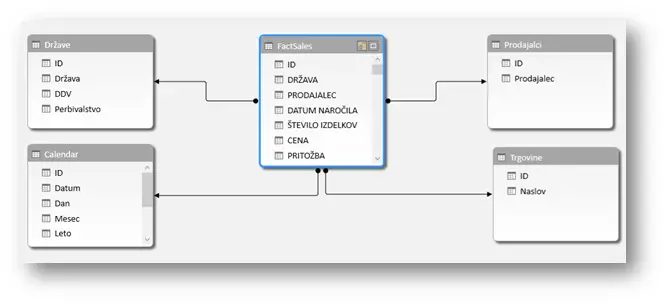
Data Sets is one of the best things that you can do when your data comes from an outside, SQL or better yet OLAP source. So why does it work with Power Pivot? Well Power Pivot is actually just and offline OLAP for Excel. If you change the .xlsx to .zip and browse through that zipfile, you will find a .data file. That is your Power Pivot data Model with all the tables and so on. But let us look at what Data Sets are used for. Given the following sample…
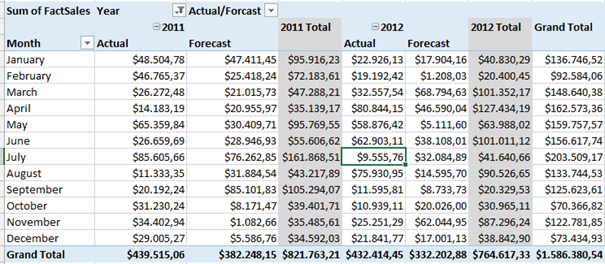
Let’s say it’s the 3rd September 2012. In our Pivot we have two Years’ worth of Actual and Forecast data. But for 2011, we don’t need the Forecast, and for 2012 we need both Actual and Forecast. Now if we were to turn off Forecast at a filter level,

then that would turn off Forecast for the entire Pivot Table.
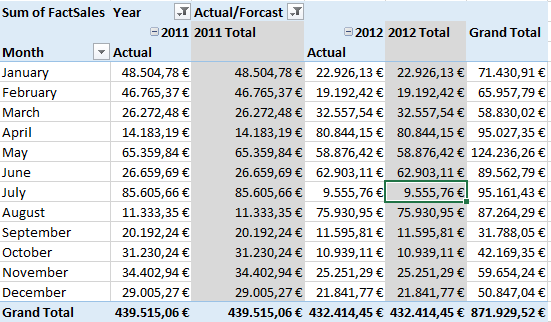
But that is not the desired result. Whereas we would like to hide the Forecast for 2011, we would still like to have it visible for 2012. The word “hide” slipped out in the previous sentence, but as it’s now out there, I would like to point out, that hiding it is not the path to eternal happiness. Especially if we imagined we have more Pivot Tables where we would have to repeat the same process.
Now the screenshots above were taken with a Pivot Table created from a Table in Excel. From here on, we will be looking at the same Pivot Table, but this time created from Power Pivot data (same table but inserted into Power Pivot as a linked table). Here’s where things get really interesting.
First we will go to ANALYZE (Excel 2013) or Options (Excel 2010), then Fields, Items, & Sets and then choose Create Set Based on Column Items.
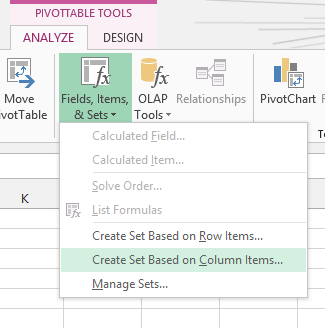
What you will get is the following window
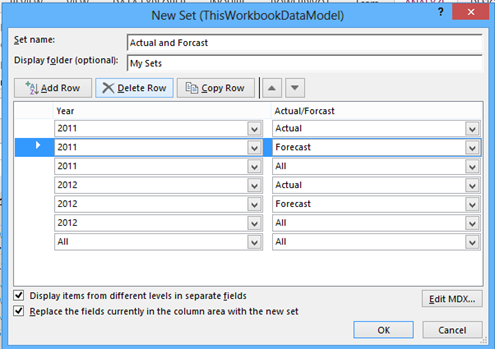
Here you can give your set a name, and then basically say which columns should be visible and which not. You can select the 2011 Forecast Row and choose the Delete Row button on top. Now since you can remove whichever row you like, you therefor remove that column from the analysis. My final view of this window was
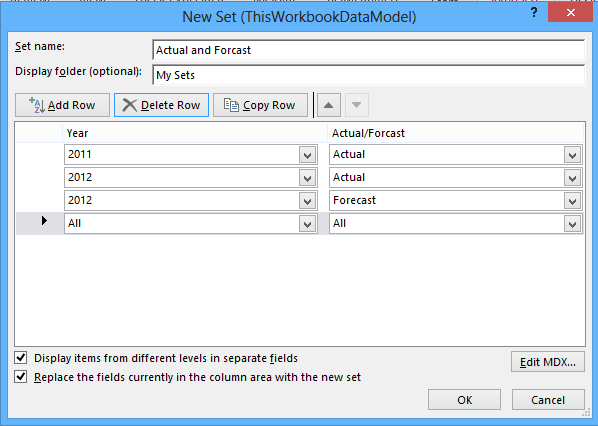
Now the moment you press OK you get

Which is good but the best thing is in the Pivot Table Field List you get
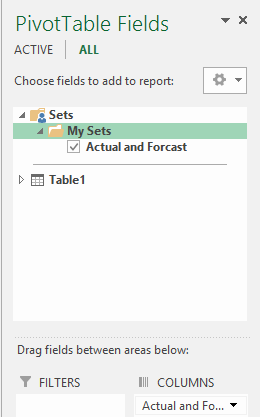
And this Sets folder will now be visible and more importantly usable in all Pivot Tables! So the same Set of Columns in another Pivot Table is just a click away. Very useful.
OLAP Tools in Excel
Now Sets were great but here is something even greater – OLAP Tools. A very important thing to understand is that Power Pivot works with all the data in RAM. But first it must pull all the data from the source. And that’s exactly what it does. If you create a Power Pivot project where you insert data from Access or SQL Server or MySQL etc. that data is stored in the file! So if you lose connectivity or you want to display your analysis somewhere where you can’t get to your SQL Server, it will work without a hitch. So all this data is in a .data file which is in the Excel files Meta Data. But that .data file is nothing else that an Offline OLAP Cube. So if you’re working on a Power Pivot data, you’re working on an OLAP Cube. And therefore you get OLAP tools. And amongst those tools, there is one unparticular, I would like to focus on. And that is Convert to Formulas.

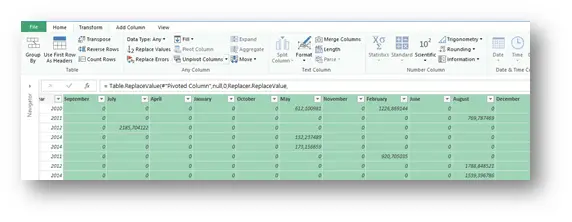
Now many times we wanted to insert a column of our own calculations into the Pivot Table. But that cannot be done. Well it cannot be done in a plain Excel Pivot Table but it can be done in a Power Pivot Pivot Table. In regular Pivot you would select GETPIVOTDATA and get the entire Pivot on another sheet and there you would insert your columns. But now it can be done right there. All you have to do is to choose Convert a Pivot Table to formulas and you will no longer have a Pivot Table per say. So you cannot choose the fields anymore, but guess what all the calculations are still active and fresh. So refreshing your Power Pivot data, refreshes these cells, but now that’s exactly what they are, just plain old cells. You can insert your own columns and do whatever calculations you want.

And even the Filters from the Pivot Table are still there, still active and still functional! Such power can be derived from the use of this functionality.
As you can see, there is far more to Power Pivot than meets the eye. It’s not just that it gives you the power to work on more than 1048576 rows of data and on multiple data sources at once, it even makes the good old pivot in excel that much better. So to finish of exactly where I started. Does a Power Pivot Pivot Table beat a regular Pivot Table. Once again, hands down, YES!
And we are still on the road to eternal happiness.
Here is a video version of this post:
Related Posts

- October 14, 2014
Probably the longest title of all times, but it leads to ...
- September 30, 2014
If some pictures are hard to view, you can get the PDF of the ...
- August 19, 2014
One might think that analyzing data with a Pivot table is hard, ...
- May 16, 2014
This is the second article of three. If you hadn’t read the ...